- Posts: 2
- Thank you received: 0
Ask the community, share ideas, and connect with other LimeSurvey users!
 Topic Author
Please Log in to join the conversation.

Please Log in to join the conversation.

Please Log in to join the conversation.

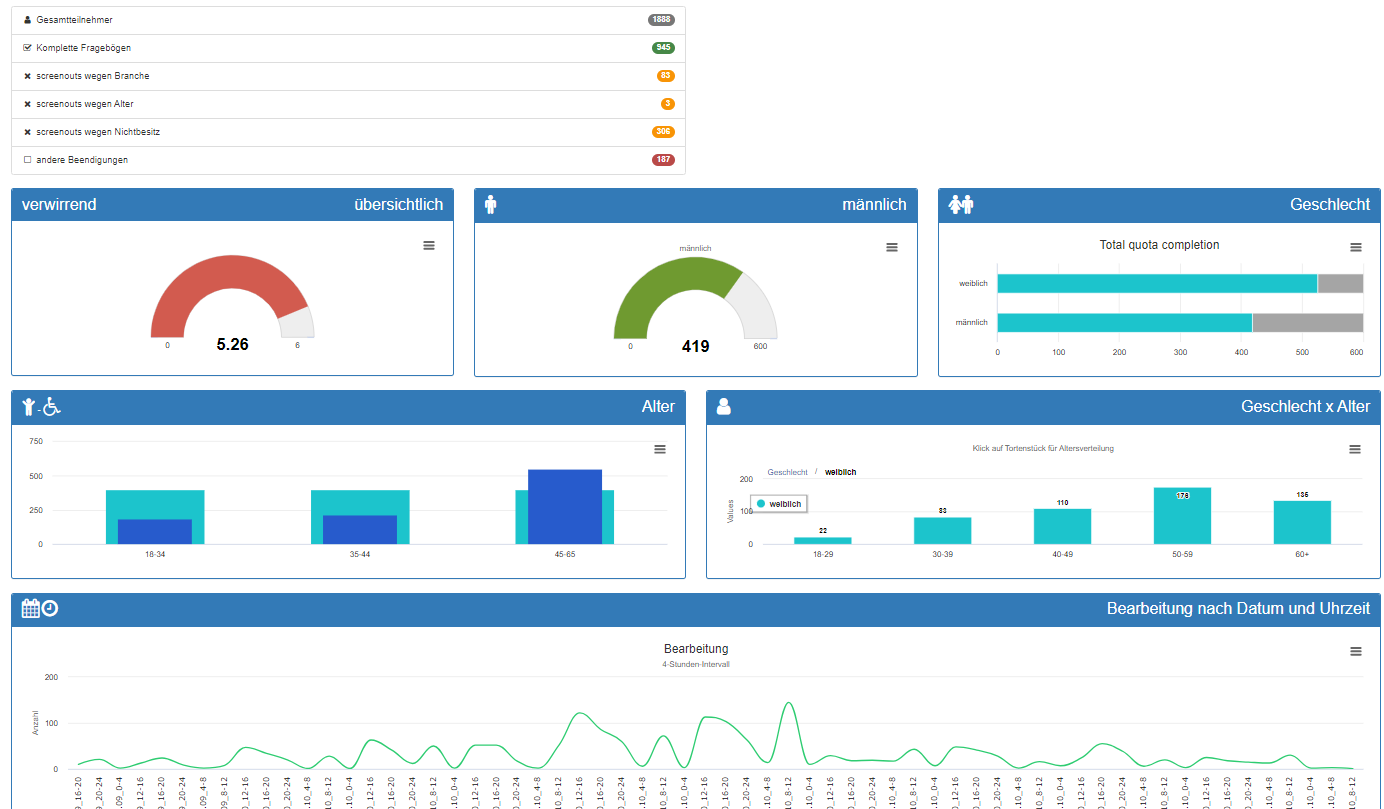
You have some sample of code for such dashboard ? Done with R ? Python ? PHP ?And if you want to do it more sophisticated, create your own dashboard.
You may access the survey data either directly or by the API.
Please Log in to join the conversation.
Please Log in to join the conversation.
$survey=853397;

$tbl_daten='lime_survey_'.$survey;
$tbl_sample='lime_tokens_'.$survey;
$tbl_timing='lime_survey_'.$survey.'_timings';
$col_browser=$survey.'X20X1057';
$col_random=$survey.'X37X1047';
$col_F1=$survey.'X20X199';
$col_F2=$survey.'X104X999';
$col_F4=$survey.'X35X201';
...
Please Log in to join the conversation.
I think it has impressed more than a customer.To be honest: It is more or less "l'art pour l'art" or to impress a customer.
")
Please Log in to join the conversation.
No usage of API ?Well, it is the bootstrap "startmin" template and the chart library "highcharts".
The rest a php script with direct access to the LS database.
To be honest: It is more or less "l'art pour l'art" or to impress a customer.
Please Log in to join the conversation.